Student writing analytics at the touch of a button
Some time ago we introduced the WriQ student experience to allow your students to take control of their own writing achievement. With access to their own Dashboard and WriQMeter, students are able to track their writing burst measures, along with other key analytics, in real time to help them understand their own writing progress. Today, we’re excited to let you know that teachers will now have access to that data as well, so you can delve a little deeper into each student's progress.

In his classic book On Writing Well, the author William Zinsser recalls a lecture he gave with another writer in which he learned that writing for some people is fun. It’s an illuminating moment for the author of dozens of books and essays, many of which are in fact about the craft of writing. For the other writer ("Dr. Brock," in the story), the revelation that writing is hard for some people, was just as illuminating. Students in your classrooms today can learn from this interaction. For some of them, writing is easy. For some, it is more difficult. Students build confidence in knowing they're not alone - that their struggle, or their joy - is shared with their peers.
For teachers, this information is hard to come by. Even in the "old days" where classrooms were filled with students, it was often hard to know which students were writing without fear and which ones struggled with every word choice. In today's hybrid and online environments, this information is even more difficult to come by - we don't get to watch our students as they think through a writing process.
Who are my "good" writers?
I would bet that for most teachers reading this right now, they know who their "good" writers are. That is, they know who produces the most consistent, high quality final products. But the road taken to get to those final products is hard to see. Even submitted draft copies are the ultimate result of an effort over time.
What we're talking about is writing fluency. That is, how easily is a student able to form an idea in their head, and express it on the page? One way to measure writing fluency is by measuring writing bursts. A writing burst is the amount of writing (number of words) produced between pauses of two seconds or more. The researchers Alves and Limpo and Torkildsen, Morkin, et al, have noted a couple of significant and relevant points about writing bursts - namely that as students become better writers, their burst length increases, and both the number and length of their pauses decrease. To put it more simply, a writing burst has been proven over time to be a really good measure of writing fluency.
But measuring writing fluency, until now, has been too laborious for any teacher. It would be impossible for a teacher to stand over every student with a stopwatch and measure their bursts as they write. Even in a 1:1 scenario this would be an arduous, tedious, and likely inexact task. Modern technology however, has made measuring and tracking a student's writing bursts a much simpler task.
Student writing progress at the touch of a button
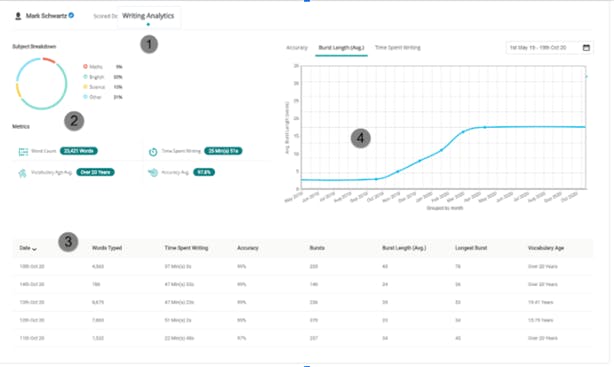
Back in January, we introduced the Student Experience for WriQ, which allowed students to see, in real time their writing burst measures, along with other key analytics to help them understand their own writing progress. Now, teachers will have access to that data as well, by clicking on the Writing Analytics (1) tab in their dashboard.
Inside that tab, you’ll see a breakdown of all the writing that student has done, across all disciplines. It’s important to note that the data is not just from the writing done for that class. The Subject Breakdown (2) chart uses academic keywords to classify student writing. We know from past research that the more writing a student does in an academic area, the more proficient they become in that area. It also lets a teacher know where their student's interests lie. The Cumulative Data Table (3) at the bottom of the page, gives a running snapshot of how much writing a student has done on any day they've typed in Google Docs (with the WriQ Extension installed). Finally, the Progress Monitoring Chart (4), similar to the chart found in the Scored Docs tab, gives teachers an easy way to track how a student is improving - or slipping - in terms of both their average Burst Length, and their Time Spent Writing. There is no question that student writing improves the more they write, and there is also convincing evidence that students perform better when they know teachers are monitoring their progress.

